Bridging the gap: Distributed tracing for Flutter and Backend
This article covers what distributed tracing is and how it works. After explaining the fundamentals, I’m going to demonstrate it with Flutter (for the app), dart_frog (for the backend) and Sentry (as the tool for distributed tracing).
Before we do a deep dive into the topic, I have to explain a few terms, so that we’re all on the same page. Distributed tracing is a subset of application performance monitoring (APM). I’m going to refer to APM tools in this article, and by that I mean a service which receives tracing information from your system and allows you to view those traces.
Distributed Tracing
The goal of distributed tracing is to figure out how the whole system performs across all the different parts like an app, a backend, cloud functions, databases, and so on. In this article, I’m just covering the app and a simple backend, though. In order to figure out how the system performs, we trace the flow of a request from the app to the backend. Based on that data, you should, later on, be able to troubleshoot requests that exhibit high latency or errors.
Let’s start with a concrete example for end to end distributed tracing: Imagine a simple weather app as an example. When the app starts, it requests the location of the user, then uses the location to request the correct weather data for it from the backend. The backend receives that request, parses it, to look up and fetch the weather data from its database, and then returns it to the app. The app gets the response, parses it and shows it to the user.
Typically, a trace for the above example is visualized in a flame chart, and it looks something like the following image.
![]()
Each of the rectangles in the image above represents a so-called span. The red rectangle is the transaction, which is another word for the root or parent span. Every other rectangle is a (child) span. All spans and the transaction combined is called a trace. Now that we know the nomenclature, let’s look at it in some more detail. Given the weather example from above, the red transaction is started at the app start and ends after the weather data was shown to the user. The yellow span lasted for the time it took to locate the user, and the pink span represents the HTTP request from the point of view of the app. The green represents the rendering of the received information. Those four spans are happening in the app. The light blue span is the HTTP requests from the point of view of the server, and the dark blue span represents the time it took to load the weather data from the database. Those two spans occurred on the server.
Distributed tracing allows us to view all spans together as one trace.
Each transaction and each span has a unique ID and a so-called context. The IDs allow us to correlate the spans and transactions. The context is enriched with meta-data about the span’s underlying operation. A context for HTTP requests is for example marked as an HTTP operation and has additionally data about the request’s URL and the used headers. This is later helpful to figure out what has happened in a particular trace.
Now, you might ask yourself, how do we connect spans from the app and spans from the backend? It’s actually quite easy, if you think about it. We’re just going to add a header to each HTTP request which contains the transaction ID. The application knows the current active transaction when making a request and thus can add it to the request. The backend reads the header and uses the given transaction ID in order to start a child span. This process of telling other systems about the transaction is called context propagation.
Adding code to trace operations in your software is called instrumentation. Though, we don’t want to do the above-mentioned process of adding a tracing header ourselves. Manual instrumentation consumes valuable engineering time, and it can introduce bugs in your application. Instead, we want automatic instrumentation. In this article, we’re using Sentry mostly because I’m familiar with it. But you can of course choose from all the other APM tools available, like Datadog, Dynatrace or even the open standard OpenTelemetry. Sentry provides ready-made automatic instrumentation for a lot of functionality in Flutter and Dart, and instrumenting HTTP requests is one of them.
That’s it. Enough theory, show me the examples!
Diving into the code
TL;DR The example code can be found here.
Part 1: Instrumenting the app
We’re building a pretty simplified application which just demonstrates
how to do distributed tracing. The starting point is a freshly created
Flutter project. We’re adding dependencies to
sentry_flutter and
http.
With that done, we can start writing code. We’ll initialize Sentry and enable tracing.
// First we'll need to initialize Sentry and enable tracing
Future<void> main() async {
  await SentryFlutter.init(
    (options) {
      options.dsn = 'https://example@sentry.io/add-your-dsn-here';

      // Should not be set to a much lower value in production.
      // Though during testing we want to receive every trace.
      options.tracesSampleRate = 1;
    },
  );
  runApp(const MyApp());
}
After that’s done, we’ll add instrumentation for observing the navigation. That instrumentation will start a new root transaction on every navigation, including the app start.
class MyApp extends StatelessWidget {
  const MyApp({super.key});

  @override
  Widget build(BuildContext context) {
    return MaterialApp(
      title: 'Distributed Tracing',
      theme: ThemeData(primarySwatch: Colors.blue),
      home: const MyHomePage(),
      // Add the `SentryNavigatorObserver` in order to start root transactions
      navigatorObservers: [SentryNavigatorObserver()],
    );
  }
}
Next up is the API client. The SentryHttpClient is responsible for the
context propagation, so that the trace from the app is continued on the
backend.
class WeatherApi {
  // The SentryHttpClient does the context propagation
  final Client _client = SentryHttpClient(client: Client());

  Future<Weather> getWeather(String location) async {
    final response = await _client.get(Uri.parse('http://localhost'));
    final json = jsonDecode(response.body);

    return Weather.fromJson(json);
  }
}
Now that we’ve wired up all the instrumentation, we can request the
actual weather data and show it in the app. The WeatherApi is used in
conjunction with the FutureBuilder to request the weather data from
the backend and show it to the user.
class MyHomePage extends StatefulWidget {
  const MyHomePage({super.key});

  @override
  State<MyHomePage> createState() => _MyHomePageState();
}

class _MyHomePageState extends State<MyHomePage> {
  final WeatherApi _api = WeatherApi();
  late final Future<Weather> _weather = _api.getWeather('New York');

  @override
  Widget build(BuildContext context) {
    return Scaffold(
      appBar: AppBar(title: const Text('Weather')),
      body: Center(
        child: FutureBuilder<Weather>(
          future: _weather,
          builder: (context, snapshot) {
            if (snapshot.hasError) {
              return const Text('Oops, something went wrong');
            }
            if (snapshot.hasData) {
              return Text(
                'The current temperature '
                'is ${snapshot.data!.degrees}',
              );
            }
            return const CircularProgressIndicator();
          },
        ),
      ),
    );
  }
}
That’s it for the app. Next up, the backend.
Part 2: Instrumenting the backend
For the server, we’re using
dart_frog
and the
sentry_dart_frog package.
After we’ve created and added the dependencies, we need to initialize Sentry.
Future<HttpServer> run(Handler handler, InternetAddress ip, int port) async {
  await Sentry.init((options) {
    options
      ..dsn = 'https://example@sentry.io/add-your-dsn-here'
      // Should not be set to a much lower value in production.
      // Though during testing we want to receive every trace.
      ..tracesSampleRate = 1
      ..debug = true
      ..addDartFrogInAppExcludes();
  });
  return serve(handler, ip, port);
}
Next up, we need to add the Sentry middleware to enable the context propagation.
Handler middleware(Handler handler) {
  return handler
      .use(sentryMiddleware);
}
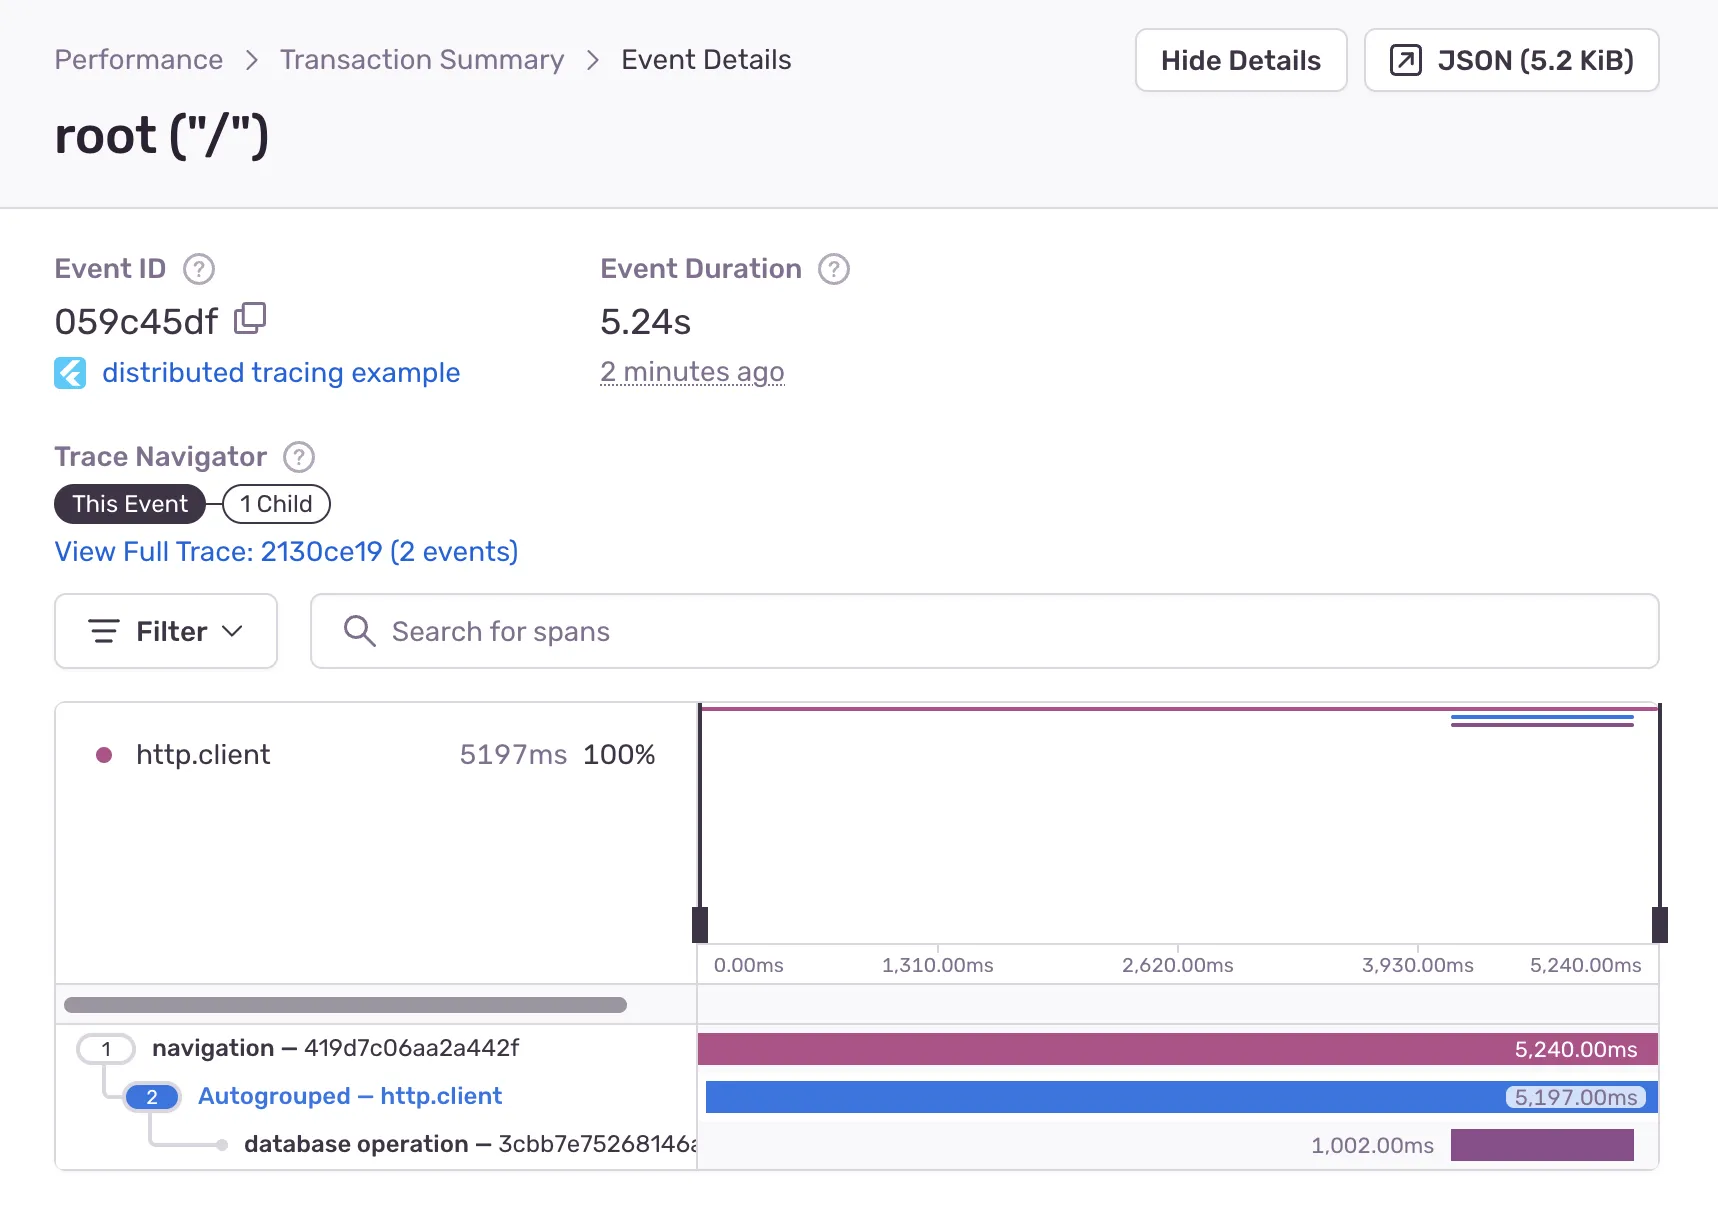
Of course, the actual endpoint for getting the weather data needs to be implemented too, but that’s not really relevant here. So that’s it. Distributed tracing is fully implemented and usable. For this very simple example, the distributed trace in Sentry looks something like the following screenshot.
The top span is the root transaction, which is started on app start. The blue span is the HTTP operation of the app, grouped together with the HTTP operation of the server. The bottom span represents the time it took to load the data from the database.
It’s not just pretty cool to see how a request flows through multiple systems, but also quite insightful. I hope you learned a lot from this blog post and that you will use your new superpower to improve your project.
Originally published on Medium.